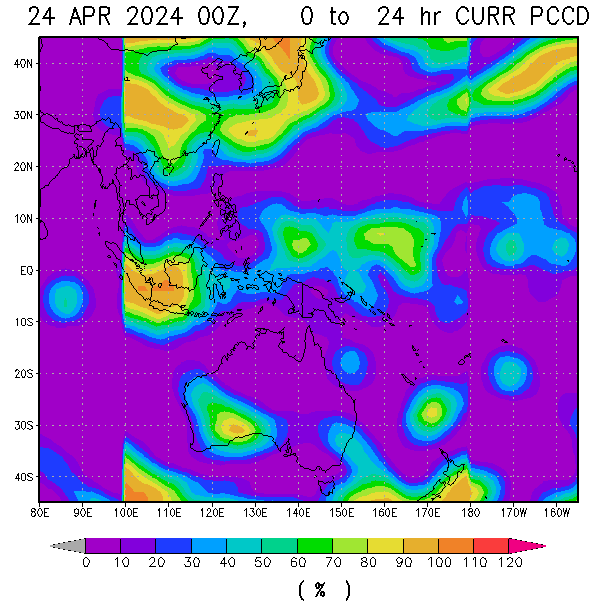
Sea surface temperatures in the central equatorial Pacific have continued to cool over the past fortnight, and hence the tropical Pacific is now generally cooler than average east of the date-line. Below the surface, temperatures also remain significantly cooler than average, with some areas more than 4°C cooler than normal. Trade winds in the western Pacific remain stronger than normal and cloudiness near the date-line continues to be suppressed. These indicators, together with the Southern Oscillation Index (SOI), which has been positive since April, are consistent with the developing stages of a La Niña event.
The majority of climate models surveyed by the Bureau suggest current patterns and trends will continue, with a significant likelihood of further ocean cooling beyond La Niña thresholds before the end of the southern winter.
Historically, about 35 to 40% of El Niño events (such as occurred in 2009/10) are followed by a La Niña within the same year. The combination of current trends and model outlooks suggest the chance of a La Niña in 2010 is now clearly more likely than not.
SST: he central and eastern tropical Pacific Ocean continued to cool during June. The sea surface temperature (SST) anomaly map for June (SEE BELOW OF THIS BLOG) shows a large area of cooler than normal water stretching along the equator east of 160°W, with some areas of the ocean more than 1°C cooler than normal for this time of the year. Warm anomalies exceeding +1°C remain in the Maritime Continent region.
SUBSURFACE (THERMOCLINE): The map for the 5 days ending 5 July shows a large volume of cooler than normal water evident below the surface of the equatorial Pacific Ocean (SEE BELOW OF THIS BLOG), with anomalies more than 4°C cooler than normal for this time of the year in the central Pacific, on a weekly scale. Sub-surface temperatures have changed little over the past two weeks.
SOI: he SOI has fallen over the past over the past five weeks, but remains positive. The SOI has been consistently positive since early April. The latest (5 July) 30-day SOI value is +4, while the value for June was +1.8. The monthly value peaked at +15 for the month of April.
TRADE WINDS: Strong easterly trade winds are present in the equatorial Pacific west of the date-line. East of the date-line, trade winds remain close to average for this time of the year. Wind anomalies are shown below of this blog for the five days ending 5 July.
IOD: The latest weekly value of the Indian Ocean Dipole (IOD) index is slightly positive, but well within the neutral range. The IOD remains in a neutral phase.
SOURCE: AUSTRALIAN GOVERNMENT- BUREAU OF METEOROLOGY
NOTE: Real time La Niña imagery can be found just below of this blog.
JUST VOTE OR COMMENT FOR FEEDBACK


No comments:
Post a Comment