


 LATEST SATELLITE IMAGES 12:00P
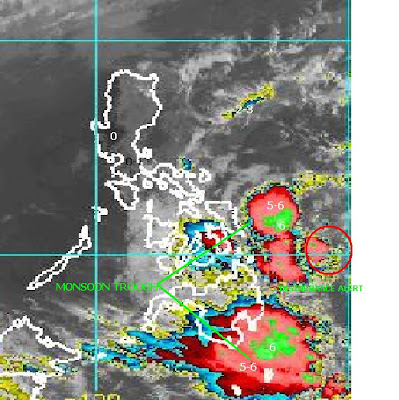
 Tropical Disturbance Alert Unnamed
Between 11.0-11.5N, 131.5-133.5E (based on latest vortices image)
15kts winds
1010mb SLP
moving WNW at approximately 3-5kts.
Convection at L5-6 slowly wrapping over near LLCC and maintained its deepness due to excellent equatorial outlflow and fair pole ward outflow.
Warm SST and good Ocean heat content are over the area.
Possibility it may become a severe alert system likely within the next 24hrs as its vortices continues to increase for the past 6hrs and its pole ward outflow slowly improving based on water vapour imagery.
*Valid for 6 hours only and subject to change prior notice.
*Valid for 6 hours only and subject to change prior notice.
Level of convection/raincloud based on Funk top Satellite Image
L0 (BLACK) = No clouds with some cloudy
L1 (GRAY) = Cloudy with some overcast
L2 (YELLOW) = Overcast with some drizzle
L3 (BLUE) = Drizzle with some Light Rain/shower
L4 (RED) = Light rain/shower with some Moderate Rain/shower
L5 (PINK) = Moderate Rain/shower with some Heavy rain/shower
L6 (GREEN) = Heavy with some Very Heavy shower
L7 (WHITE) = Very Heavy with some Blinding Rain
Stages of Tropical Cyclone in terms of wind speed
TDWC= Tropical disturbance watch (2nd stage): <15kts
TDA= Tropical disturbance Alert (3rd stage): 15-20kts
TDSA=Tropical disturbance Severe Alert (4th stage): 20-25kts
MTD=Minimal tropical Depression: 25-30kts
STD=Severe Tropical Depression: 30-35kts
MTS=Minimal Tropical Storm: 35-43kts
SRTS=Strong Tropical Storm: 43-54kts
SVTS=Severe Tropical Storm: 54-64kts
C1= Category 1 (Minimal): 64-82kts
C2= Category 2 (Average): 83-95kts
C3= Category 3 (Strong): 96-113kts
C4= Category 4 (Severe): 114-135kts
C5= Category 5 (Super): >135kts
SOURCES:
http://rammb.cira.colostate.edu/products/tc_realtime/
http://lake.nascom.nasa.gov/Giovanni/tovas/realtime.3B41RT.shtml
http://www.aoml.noaa.gov/phod/cyclone/data/np.html
www.nrlmry.navy.mil/tc_pages/tc_home.html
http://trmm.gsfc.nasa.gov/trmm_rain/Events/auto_pr_slice.html
www.jma.go.jp/en/g3/
http://www.ssd.noaa.gov/mtsat/wpac.html
http://www.ssd.noaa.gov/PS/TROP/floaters.html
http://www.goes.noaa.gov/sohemi/SHGMSCOLW.JPG
http://www.goes.noaa.gov/guam/GUAMCOL.JPG
http://cimss.ssec.wisc.edu/tropic/real-time/westpac/winds/winds.html
Information and/or data listed above are supported by all sources indicated above. This was done for record and usage for future observation relevant to tropical cyclone formation.


1 comment:
Very interesting article, i wonder if you found some similar idea about Satellite Image Analysis in here
http://www.imagesatintl.com/services/satellite-image-analysis/
Post a Comment