Central Pacific Ocean temperatures remain well above El Niño thresholds, with significant areas east of the date-line continuing to exceed their average by more than 2°C. However, the central to eastern Pacific has continued to cool since the peak of the El Niño warmth in late December and early January. The sub-surface of the equatorial Pacific has also cooled over the last month, which historically indicates that a return to neutral conditions may be under way.
This view is supported by climate models which suggest that tropical Pacific temperatures should gradually ease towards more average values over the coming months, though are likely to remain above El Niño thresholds until the southern autumn.
A weakening of the Trade Winds over the western to central Pacific during the past fortnight, has resulted in a fall in the Southern Oscillation Index and an increase in tropical cloudiness. Although it is likely to be temporary, the cooling of the Pacific may slow as a result of the weakened Trades.
The influence of El Niño events on Australian rainfall typically declines by mid to late summer. We've already seen evidence of this with widespread above average falls across northern Australia in January, and further heavy rain across parts of inland eastern Australia so far in February.
The Indian Ocean Dipole (IOD) has a reduced impact upon Australia over the summer months.
- The tropical Pacific Ocean sea surface remains warmer than the long-term average in central and eastern areas.
- The sub-surface water of the tropical Pacific also remains warmer than the long-term average, although it has cooled slightly in recent weeks.
- The latest approximate 30-day SOI value is −13; The SOI has fallen rapidly over the last week after rising through most of January.
- Trade winds have weakened significantly in the last fortnight, with westerly wind anomalies evident across both the western and central equatorial Pacific this week.
- Cloudiness near the date-line remains above average.
- Most leading international computer models surveyed by the Bureau predict tropical Pacific temperatures to cool, although are likely to remain above El Niño thresholds until the southern hemisphere autumn.
The Pacific Ocean sea surface temperature (SST) remains warmer than the long-term average across the central and eastern tropical Pacific. The SST anomaly map for January shows warm anomalies in excess of +1°C covering most of the tropical Pacific east of the dateline, with anomalies exceeding +2°C in parts of the central Pacific. The map also shows near-normal SSTs covering most of the western Pacific and northern waters around Australia. The monthly NINO indices for January were +1.1°C, +1.5°C and +1.2°C for NINO3, NINO3.4 and NINO4 respectively. All NINO indices cooled in relation to the December anomalies.
In terms of weekly data, the most recent NINO indices are +0.9°C, +1.2°C and +1.0°C for NINO3, NINO3.4 and NINO4 respectively. When compared with two weeks ago, each of the NINO indices has cooled slightly; NINO3 and NINO4 cooled by approximately 0.3°C, and NINO3.4 by approximately 0.5°C. The 7-day SST anomaly map shows warm anomalies in excess of +1°C covering most of the tropical Pacific east of 170°E, while ocean temperatures are more than 2°C above average between the date-line and 140°W. When compared with anomalies observed a fortnight ago, the central and eastern Pacific sea surface has cooled slightly. An animation of recent SST changes is available.
A four-month sequence of sub-surface Pacific Ocean equatorial temperature anomaly shows a peak in sub-surface warmth during November, with anomalies in excess of +4°C evident between 110°W and 140°W. During December and January, weak cool anomalies propogated eastwards displacing some of the warm anomalies along the thermocline, particuarly in the central Pacific. A recent map for the 5 days ending 1 February shows that a large volume of warmer than normal water persists below the surface of the tropical Pacific east of the dateline, with anomalies exceeding +3°C in the eastern Pacific. When compared with two weeks ago, the sub-surface of the equatorial Pacific has slightly cooled. An animation of recent sub-surface changes is available.
An archive of past SST and sub-surface temperature charts is available.
Trade winds have weakened significantly during the last fortnight, with a strong westerly wind burst observed over the western Pacific. Westerly wind anomalies are now evident across both the central and western equatorial Pacific. Trade winds remain stronger than normal in the eastern Pacific after strengthening in early January. The latest weekly wind anomalies are shown in the TAO/TRITON map (small image above) for the five days ending 1 February.
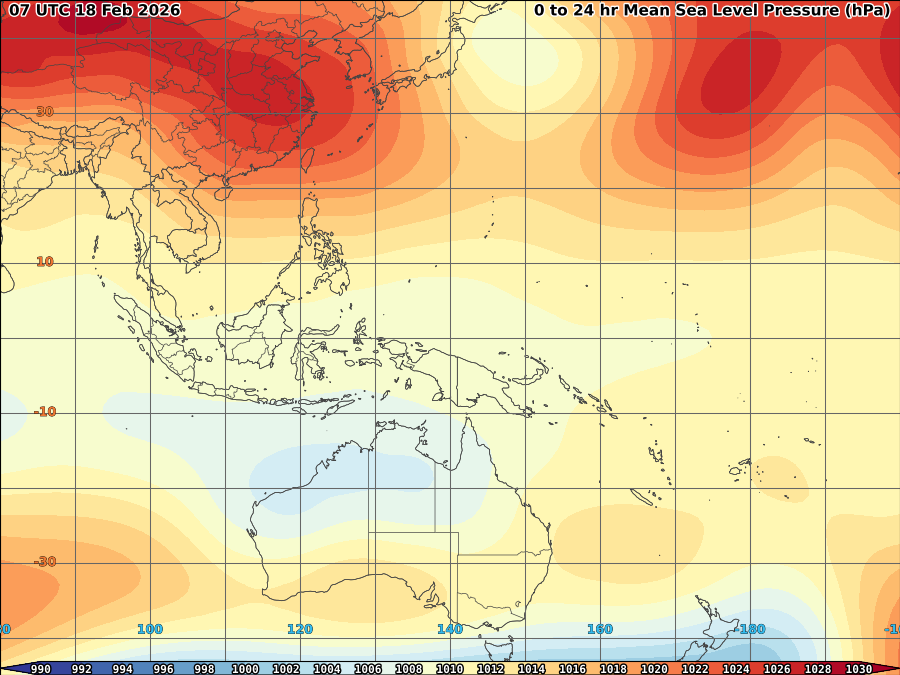
The SOI increased slowly through January, after being relatively stable for most of December. The SOI dropped rapidly during the last week due to a sharp decline in the MSLP over Tahiti. This fall in the SOI is due to the strong westerly wind anomalies in the central Pacific. The current 30-day SOI value (1 February) is −13. The monthly value for January was −10. (SOI graph, SOI table).
Cloudiness near the date-line across the equatorial Pacific is another important indicator of El Niño conditions, as it typically increases near and to the east of the dateline during these episodes. Cloudiness near the dateline increased during the last two months with recent high levels coinciding with a westerly wind burst currently over the western and central Pacific.
Most international computer models are predicting that the warm tropical Pacific Ocean temperatures will persist in El Niño regions over the remainder of the southern hemisphere summer and into autumn. The majority of models are predicting a gradual cooling of SSTs by April and a return to neutral conditions by the southern hemisphere autumn or winter. Typically, autumn is a transitional period for ENSO, hence model predictions of El Niño that forecast through this period are less reliable than at other times of the year. Recent forecasts from the POAMA model, run daily at the Bureau of Meteorology, show a gradual cooling with SSTs returning to neutral conditions during the southern hemisphere winter.SOURCE: AUSTRALIAN BUREAU OF METEOROLOGY.
JUST VOTE OR COMMENT FOR FEEDBACK


No comments:
Post a Comment