WELCOME TO TYPHOON AND WEATHER IMAGERY. THIS BLOG CONTAINS REAL TIME WEATHER, TROPICAL CYCLONE UPDATES AND IMAGERY, AND TROPICAL CYCLONE FORECAST. CONTENTS OF DROP DOWN MENU CAN BE FOUND AFTER PHILIPPINE IMAGERY BELOW (SCROLL DOWNWARD). THANK YOU VERY MUCH FOR VISITING THIS SITE. YOU ARE FREE TO MAKE ANY COMMENT(S) OR FEEDBACK(S) ABOUT THIS BLOG. MAY 29, 2025 - 10PM SYNOPSIS: Southwesterly Windflow affecting the western section of Luzon and Visayas.

ACTIVE LOW OR TROPICAL CYCLONES

CLICK IMAGERIES TO REDIRECT ON COMPLETE IMAGERIES AND INFORMATIONS (Imageries will be seen after Philippines imagery below)

96W/#CrisingPH

LANGUAGE TRANSLATION

PHILIPPINES RADAR COURTESY OF RAINVIEWER THRU PAGASA DOPPLER RADAR


NCR DOPPLER RADAR

PHILIPPINES DOPPLER RADAR
RealEarth


Showing posts with label EL NINO. Show all posts

1998-2010 QUARTERLY RAINFALL IN METRO MANILA

Selected parameter: Monthly TRMM 3B43(V6) Accumulated Rainfall
Selected area: lat=[14.30N,14.70N], lon=[120.85E,121.20E]

METRO MANILA

Unit: (mm)

JAN-MARCH 2010

Latitude Longitude AccRain
14.300 120.850 33.3603**
14.300 121.100 118.5990
14.550 120.850 36.9153
14.550 121.100 123.8150

JAN-MARCH 2009

Latitude Longitude AccRain
14.300 120.850 127.3960
14.300 121.100 430.6200
14.550 120.850 141.2950
14.550 121.100 456.2110

JAN-MARCH 2008

Latitude Longitude AccRain
14.300 120.850 180.8070
14.300 121.100 484.0580*
14.550 120.850 186.3120
14.550 121.100 475.4030

JAN-MARCH 2007

Latitude Longitude AccRain
14.300 120.850 155.2460
14.300 121.100 342.9180
14.550 120.850 148.4360
14.550 121.100 340.8100

JAN-MARCH 2006

Latitude Longitude AccRain
14.300 120.850 157.7340
14.300 121.100 382.1860
14.550 120.850 181.5360
14.550 121.100 399.5150

JAN-MARCH 2005

Latitude Longitude AccRain
14.300 120.850 63.2183
14.300 121.100 91.5397
14.550 120.850 46.4131
14.550 121.100 118.1730

JAN-MARCH 2004

Latitude Longitude AccRain
14.300 120.850 71.6025
14.300 121.100 191.2130
14.550 120.850 69.7211
14.550 121.100 190.5610

JAN-MARCH 2003

Latitude Longitude AccRain
14.300 120.850 35.6987
14.300 121.100 124.5990
14.550 120.850 37.8541
14.550 121.100 122.1030

JAN-MARCH 2002

Latitude Longitude AccRain
14.300 120.850 59.5048
14.300 121.100 162.1750
14.550 120.850 56.9598
14.550 121.100 157.9130

JAN-MARCH 2001

Latitude Longitude AccRain
14.300 120.850 210.2580
14.300 121.100 361.7220
14.550 120.850 219.5190
14.550 121.100 353.3610

JAN-MARCH 2000

Latitude Longitude AccRain
14.300 120.850 220.6630
14.300 121.100 374.5130
14.550 120.850 206.8840
14.550 121.100 356.6490

JAN-MARCH 1999

Latitude Longitude AccRain
14.300 120.850 233.5450
14.300 121.100 473.4600
14.550 120.850 199.9410
14.550 121.100 457.0470

JAN-MARCH 1998

Latitude Longitude AccRain
14.300 120.850 41.1616
14.300 121.100 84.3404
14.550 120.850 48.6213
14.550 121.100 99.7309


Selected parameter: Monthly TRMM 3B43(V6) Accumulated Rainfall
Selected area: lat=[14.30N,14.70N], lon=[120.85E,121.20E]

METRO MANILA

Unit: (mm)

APR-JUNE 2010

Latitude Longitude AccRain
14.300 120.850 258.4010
14.300 121.100 255.4740
14.550 120.850 272.6250
14.550 121.100 274.351

APR-JUNE 2009

Latitude Longitude AccRain
14.300 120.850 1049.9700*
14.300 121.100 1024.6700
14.550 120.850 1034.6800
14.550 121.100 1027.5700

APR-JUNE 2008

Latitude Longitude AccRain
14.300 120.850 608.5740
14.300 121.100 705.5700
14.550 120.850 582.9530
14.550 121.100 719.5320

APR-JUNE 2007

Latitude Longitude AccRain
14.300 120.850 280.4160
14.300 121.100 325.8420
14.550 120.850 240.4810**
14.550 121.100 323.1980

APR-JUNE 2006

Latitude Longitude AccRain
14.300 120.850 341.7580
14.300 121.100 360.1560
14.550 120.850 343.3860
14.550 121.100 386.2450

APR-JUNE 2005

Latitude Longitude AccRain
14.300 120.850 337.2930
14.300 121.100 367.8230
14.550 120.850 399.5850
14.550 121.100 446.3260

APR-JUNE 2004

Latitude Longitude AccRain
14.300 120.850 704.5040
14.300 121.100 498.4870
14.550 120.850 740.1190
14.550 121.100 518.7470

APR-JUNE 2003

Latitude Longitude AccRain
14.300 120.850 651.4490
14.300 121.100 610.7400
14.550 120.850 674.6310
14.550 121.100 644.4280

APR-JUNE 2002

Latitude Longitude AccRain
14.300 120.850 252.2220
14.300 121.100 282.6960
14.550 120.850 252.5050
14.550 121.100 283.2420

APR-JUNE 2001

Latitude Longitude AccRain
14.300 120.850 539.0730
14.300 121.100 563.4520
14.550 120.850 536.9810
14.550 121.100 551.4270

APR-JUNE 2000

Latitude Longitude AccRain
14.300 120.850 533.4440
14.300 121.100 502.8780
14.550 120.850 634.7290
14.550 121.100 572.4050

APR-JUNE 1999

Latitude Longitude AccRain
14.300 120.850 479.8550
14.300 121.100 573.4910
14.550 120.850 531.3320
14.550 121.100 565.0510


APR-JUNE 1998

Latitude Longitude AccRain
14.300 120.850 289.4390
14.300 121.100 291.7880
14.550 120.850 276.5680
14.550 121.100 281.2440


Selected parameter: Monthly TRMM 3B43(V6) Accumulated Rainfall
Selected area: lat=[14.30N,14.70N], lon=[120.85E,121.20E]

METRO MANILA

Unit: (mm)

JULY-SEPT 2010

Latitude Longitude AccRain
14.300 120.850 956.0910
14.300 121.100 886.8390
14.550 120.850 941.4060
14.550 121.100 937.2600

JULY-SEPT 2009

Latitude Longitude AccRain
14.300 120.850 1407.7900
14.300 121.100 1286.2500
14.550 120.850 1452.6600
14.550 121.100 1368.1600

JULY-SEPT 2008

Latitude Longitude AccRain
14.300 120.850 1194.7300
14.300 121.100 924.0140
14.550 120.850 1263.2200
14.550 121.100 989.5200

JULY-SEPT 2007


Latitude Longitude AccRain
14.300 120.850 1333.2800
14.300 121.100 978.1810
14.550 120.850 1349.9000
14.550 121.100 1029.6900

JULY-SEPT 2006

Latitude Longitude AccRain
14.300 120.850 1257.1400
14.300 121.100 977.9360
14.550 120.850 1283.7300
14.550 121.100 1019.3400

JULY-SEPT 2005

Latitude Longitude AccRain
14.300 120.850 1095.6000
14.300 121.100 993.5760
14.550 120.850 1146.7400
14.550 121.100 1036.7600

JULY-SEPT 2004

Latitude Longitude AccRain
14.300 120.850 967.7300
14.300 121.100 840.6040
14.550 120.850 1033.8600
14.550 121.100 976.7180

JULY-SEPT 2003

Latitude Longitude AccRain
14.300 120.850 1207.7900
14.300 121.100 1030.5600
14.550 120.850 1337.9200
14.550 121.100 1162.0200

JULY-SEPT 2002

Latitude Longitude AccRain
14.300 120.850 1683.1000
14.300 121.100 1578.7800
14.550 120.850 1729.4500*
14.550 121.100 1702.2300

JULY-SEPT 2001

Latitude Longitude AccRain
14.300 120.850 980.3590
14.300 121.100 912.1410
14.550 120.850 1022.3500
14.550 121.100 967.1510

JULY-SEPT 2000

Latitude Longitude AccRain
14.300 120.850 1392.3200
14.300 121.100 1251.9600
14.550 120.850 1467.4200
14.550 121.100 1342.4800

JULY-SEPT 1999

Latitude Longitude AccRain
14.300 120.850 1383.7200
14.300 121.100 1154.1400
14.550 120.850 1470.1800
14.550 121.100 1227.7000

JULY-SEPT 1998

Latitude Longitude AccRain
14.300 120.850 796.3970
14.300 121.100 736.2750**
14.550 120.850 833.6810
14.550 121.100 789.0940


*Highest rainfall
**Lowest rainfall


JUST VOTE OR COMMENT FOR FEEDBACK

1998-2010 JANUARY-OCTOBER TOTAL RAINFALL IN METRO MANILA

1998-2010 JANUARY-OCTOBER RAINFALL IN METRO MANILA


Selected parameter: Monthly TRMM 3B43(V6) Accumulated Rainfall Selected area: lat= 14.30N,14.70N], lon=[120.85E,121.20E]


METRO MANILA


Unit: (mm)


JAN-OCTOBER 2010


Latitude Longitude AccRain
 14.300  120.850    1559.3900
 14.300  121.100    1538.9300
 14.550  120.850    1575.3300
 14.550  121.100    1623.4800


JAN-OCTOBER 2009


Latitude Longitude AccRain
 14.300  120.850    2851.1600
 14.300  121.100    3053.7000*
 14.550  120.850    2910.4800
 14.550  121.100    3192.7800*


JAN-OCTOBER 2008


Latitude Longitude AccRain
 14.300  120.850    2235.1700
 14.300  121.100    2577.5500
 14.550  120.850    2276.0900
 14.550  121.100    2698.7500


JAN-OCTOBER 2007


Latitude Longitude AccRain
 14.300  120.850    2023.9500
 14.300  121.100    1949.0900
 14.550  120.850    1986.7700
 14.550  121.100    1987.4100


JAN-OCTOBER 2006


Latitude Longitude AccRain
 14.300  120.850    1890.0300
 14.300  121.100    1909.8600
 14.550  120.850    1963.0400
 14.550  121.100    2021.9300


JAN-OCTOBER 2005


Latitude Longitude AccRain
 14.300  120.850    1713.6100
 14.300  121.100    1844.2700
 14.550  120.850    1835.8000
 14.550  121.100    2021.5800


JAN-OCTOBER 2004


Latitude Longitude AccRain
 14.300  120.850    1848.6800
 14.300  121.100    1722.1500
 14.550  120.850    1941.7200
 14.550  121.100    1889.9000


JAN-OCTOBER 2003


Latitude Longitude AccRain
 14.300  120.850    1997.3400
 14.300  121.100    1923.2700
 14.550  120.850    2136.6600
 14.550  121.100    2058.3100


JAN-OCTOBER 2002


Latitude Longitude AccRain
 14.300  120.850    2198.2500
 14.300  121.100    2326.1500
 14.550  120.850    2249.7900
 14.550  121.100    2467.0200


JAN-OCTOBER 2001


Latitude Longitude AccRain
 14.300  120.850    1889.4700
 14.300  121.100    2125.3300
 14.550  120.850    1940.5200
 14.550  121.100    2135.0700


JAN-OCTOBER 2000


Latitude Longitude AccRain
 14.300  120.850    2421.5500
 14.300  121.100    2461.8800
 14.550  120.850    2587.1000
 14.550  121.100    2631.7600


JAN-OCTOBER 1999


Latitude Longitude AccRain
 14.300  120.850    2476.5100
 14.300  121.100    2609.3200
 14.550  120.850    2569.9300
 14.550  121.100    2656.4600


JAN-OCTOBER 1998


Latitude Longitude AccRain
 14.300  120.850    1509.4400**
 14.300  121.100    1566.2800
 14.550  120.850    1525.0400
 14.550  121.100    1616.9700


*Highest rainfall
**Lowest rainfall


JUST VOTE OR COMMENT FOR FEEDBACK

INDIAN OCEAN DIPOLE, AN EL-NINO OF INDIAN OCEAN


The term Indian Ocean Dipole (IOD) was introduced to denote this basin-wide ocean-atmosphere coupled mode in the Indian Ocean. The positive IOD event is characterized by the strong positive Sea Surface Temperature Anomalies (SSTA) in the tropical western Indian Ocean (50oE-70oE, 10oS-10oN) and the negative SSTA in the southeastern Indian Ocean (90oE- 110oE, 10oS- Eq.). Thus the Indian Ocean Dipole Mode Index (IODMI) is defined as the zonal difference of SST anomaly of western pole from eastern pole.

The Indian Ocean has its own seesaw behavior, the Indian Ocean Dipole. During a so-called positive phase, warmer-than-usual water temperatures in the western Indian Ocean bring heavy rains to East Africa and India and colder-than-usual waters bring drought to Southeast Asia including Philippines. In the negative phase, ocean and monsoonal conditions reverse (colder-than-usual water temperatures in the western Indian Ocean bring drought to East Africa and India and warmer-than-usual waters bring heavy rains to Southeast Asia including Philippines).


The dipole is stronger in September—November and weaker in January—April than in other months and it also appears obviously inter-annual and inter-decadal variations. Although the Indian Ocean dipole in the individual year seems to be independent of ENSO in the equatorial Pacific Ocean, in general, the Indian Ocean dipole has obviously negative correlation with the Pacific Ocean dipole (similar to the inverse phase of ENSO mode). The atmospheric zonal (Walker) circulation over the equator is fundamental to relate the two dipoles to each other.


JUST VOTE OR COMMENT FOR FEEDBACK

CENTRAL PACIFIC EL-NINO SHOWING SOME DECREASE OF TEMPERATURE

Central Pacific Ocean temperatures remain well above El Niño thresholds, with significant areas east of the date-line continuing to exceed their average by more than 2°C. However, the central to eastern Pacific has continued to cool since the peak of the El Niño warmth in late December and early January. The sub-surface of the equatorial Pacific has also cooled over the last month, which historically indicates that a return to neutral conditions may be under way.
This view is supported by climate models which suggest that tropical Pacific temperatures should gradually ease towards more average values over the coming months, though are likely to remain above El Niño thresholds until the southern autumn.
A weakening of the Trade Winds over the western to central Pacific during the past fortnight, has resulted in a fall in the Southern Oscillation Index and an increase in tropical cloudiness. Although it is likely to be temporary, the cooling of the Pacific may slow as a result of the weakened Trades.
The influence of El Niño events on Australian rainfall typically declines by mid to late summer. We've already seen evidence of this with widespread above average falls across northern Australia in January, and further heavy rain across parts of inland eastern Australia so far in February.
The Indian Ocean Dipole (IOD) has a reduced impact upon Australia over the summer months.

  • The tropical Pacific Ocean sea surface remains warmer than the long-term average in central and eastern areas.
  • The sub-surface water of the tropical Pacific also remains warmer than the long-term average, although it has cooled slightly in recent weeks.
  • The latest approximate 30-day SOI value is −13; The SOI has fallen rapidly over the last week after rising through most of January.
  • Trade winds have weakened significantly in the last fortnight, with westerly wind anomalies evident across both the western and central equatorial Pacific this week.
  • Cloudiness near the date-line remains above average.
  • Most leading international computer models surveyed by the Bureau predict tropical Pacific temperatures to cool, although are likely to remain above El Niño thresholds until the southern hemisphere autumn.


The Pacific Ocean sea surface temperature (SST) remains warmer than the long-term average across the central and eastern tropical Pacific. The SST anomaly map for January shows warm anomalies in excess of +1°C covering most of the tropical Pacific east of the dateline, with anomalies exceeding +2°C in parts of the central Pacific. The map also shows near-normal SSTs covering most of the western Pacific and northern waters around Australia. The monthly NINO indices for January were +1.1°C, +1.5°C and +1.2°C for NINO3, NINO3.4 and NINO4 respectively. All NINO indices cooled in relation to the December anomalies.
In terms of weekly data, the most recent NINO indices are +0.9°C, +1.2°C and +1.0°C for NINO3, NINO3.4 and NINO4 respectively. When compared with two weeks ago, each of the NINO indices has cooled slightly; NINO3 and NINO4 cooled by approximately 0.3°C, and NINO3.4 by approximately 0.5°C. The 7-day SST anomaly map shows warm anomalies in excess of +1°C covering most of the tropical Pacific east of 170°E, while ocean temperatures are more than 2°C above average between the date-line and 140°W. When compared with anomalies observed a fortnight ago, the central and eastern Pacific sea surface has cooled slightly. An animation of recent SST changes is available.
A four-month sequence of sub-surface Pacific Ocean equatorial temperature anomaly shows a peak in sub-surface warmth during November, with anomalies in excess of +4°C evident between 110°W and 140°W. During December and January, weak cool anomalies propogated eastwards displacing some of the warm anomalies along the thermocline, particuarly in the central Pacific. A recent map for the 5 days ending 1 February shows that a large volume of warmer than normal water persists below the surface of the tropical Pacific east of the dateline, with anomalies exceeding +3°C in the eastern Pacific. When compared with two weeks ago, the sub-surface of the equatorial Pacific has slightly cooled. An animation of recent sub-surface changes is available.
Trade winds have weakened significantly during the last fortnight, with a strong westerly wind burst observed over the western Pacific. Westerly wind anomalies are now evident across both the central and western equatorial Pacific. Trade winds remain stronger than normal in the eastern Pacific after strengthening in early January. The latest weekly wind anomalies are shown in the TAO/TRITON map (small image above) for the five days ending 1 February.
The SOI increased slowly through January, after being relatively stable for most of December. The SOI dropped rapidly during the last week due to a sharp decline in the MSLP over Tahiti. This fall in the SOI is due to the strong westerly wind anomalies in the central Pacific. The current 30-day SOI value (1 February) is −13. The monthly value for January was −10. (SOI graph, SOI table).
Cloudiness near the date-line across the equatorial Pacific is another important indicator of El Niño conditions, as it typically increases near and to the east of the dateline during these episodes. Cloudiness near the dateline increased during the last two months with recent high levels coinciding with a westerly wind burst currently over the western and central Pacific.
Most international computer models are predicting that the warm tropical Pacific Ocean temperatures will persist in El Niño regions over the remainder of the southern hemisphere summer and into autumn. The majority of models are predicting a gradual cooling of SSTs by April and a return to neutral conditions by the southern hemisphere autumn or winter. Typically, autumn is a transitional period for ENSO, hence model predictions of El Niño that forecast through this period are less reliable than at other times of the year. Recent forecasts from the POAMA model, run daily at the Bureau of Meteorology, show a gradual cooling with SSTs returning to neutral conditions during the southern hemisphere winter.

SOURCE: AUSTRALIAN BUREAU OF METEOROLOGY.

JUST VOTE OR COMMENT FOR FEEDBACK
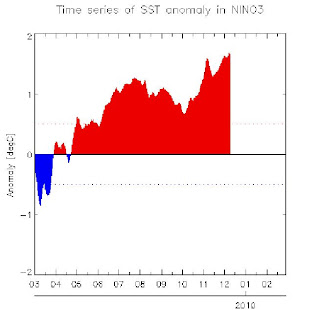
EL NINO MATURING


EL NINO ADVISORY
DEC 10 2009


Mature El Niño conditions continue to dominate the equatorial Pacific Ocean. Ocean surface temperatures in the central Pacific remain at levels not seen since the El Niño events of 2002-03 and 1997-98, with values more than 2°C above normal in places along the equator. Leading climate models continue to suggest tropical ocean temperatures will remain above El Niño thresholds into the new year, though most indicate the El Niño will decline after the southern hemisphere summer.# The tropical Pacific Ocean sea surface remains significantly warmer than the long-term average in central and eastern areas.

# The sub-surface water of the tropical Pacific remains warmer than the long-term average. The eastern Pacific has cooled slightly in the last two weeks.
# The latest approximate 30-day SOI value is −9; the monthly value for November was −7. The SOI increased in value in the second half of November, but is currently falling once again.
# Trade winds are close to normal across the central and eastern tropical Pacific. A strong westerly wind burst has weakened the Trades significantly in the western Pacific.
# Cloudiness near the date-line has increased over the past fortnight.
# Most leading international computer models surveyed by the Bureau predict that El Niño conditions will persist through the southern hemisphere summer, but decline thereafter

Sea surface temperatures (SSTs) across the tropical Pacific Ocean remained above normal for the month of November. The SST anomaly map for November is available here; the map shows warm anomalies in excess of +1°C covering most of the tropical Pacific east of 160°E, with anomalies exceeding +2°C in parts of the central Pacific. The map also shows near-normal SSTs covering most of the western Pacific and northern waters around Australia. The monthly NINO indices for November were +1.3°C, +1.7°C and +1.5°C for NINO3, NINO3.4 and NINO4 respectively. Each of the NINO regions has warmed when compared with October values; NINO3 by approximately 0.4°C, NINO3.4 by 0.6°C and NINO4 by 0.2°C.

In terms of weekly data, the most recent NINO indices are +1.5°C, +1.7°C and +1.3°C for NINO3, NINO3.4 and NINO4 respectively. When compared with two weeks ago NINO3 and NINO3.4 have risen slightly, while NINO4 has recorded a change of −0.3°C. The 7-day SST anomaly map shows warm anomalies in excess of +1°C covering most of the tropical Pacific east of the dateline. When compared with anomalies observed two weeks ago, there is little change in terms of sea surface temperatures. An animation of recent SST changes is available.

The sub-surface of the equatorial Pacific Ocean has cooled slightly in the last two weeks. However, the sub-surface still remains significantly warmer than the long-term mean and shows a clear El Niño pattern. A four-month sequence of Pacific Ocean equatorial temperature anomaly is available here. The sequence shows cooling of the sub-surface through August and September followed by a relatively rapid warming through October and November, particuarly in the eastern equatorial Pacific. A recent map for the 5 days ending 6 December shows a large volume of sub-surface water more than 2°C warmer than normal for this time of the year extending across much of the central to eastern equatorial Pacific. Warm anomalies in excess of 5°C are evident between 140°W and 100°W on a weekly scale. When compared with two weeks ago, the western and central sub-surface has cooled slightly. This is related to the return to normal Trade wind conditions. An animation of recent sub-surface changes is available.

An archive of past SST and sub-surface temperature charts is available.

Trade winds remain at relatively normal conditions across most of the tropical Pacific. A westerly wind burst has emerged in the western equatorial Pacific warming the underlying ocean. The latest weekly wind anomalies are shown in the TAO/TRITON map (small image above) for the five days ending 6 December.

The SOI increased through November, but has been decreasing again since the start of December. This follows the rapid fall in the value of the SOI during October. The latest (7 December) approximate 30-day SOI value is −9; the monthly value for November was −7, after October was −15. The SOI remains at values typical of an El Niño event SOI graph, SOI table).

Cloudiness near the date-line over the equatorial Pacific is another important indicator of ENSO conditions. Cloudiness near the dateline has been mostly above average since July, consistent with a developing El Niño. Negative OLR anomalies have increased during the last two weeks while cloudiness over Indonesia and much of northern Australia has remained below average during this period.

Most international computer models are predicting that El Niño conditions will persist throughout the southern hemisphere summer. Five of six international models surveyed by the Bureau of Meteorology forecast SSTs to remain above threshold levels into early 2010. A majority of computer models are predicting that Pacific Ocean SSTs will start to cool by March next year, which is the typical timing for the decay of El Niño events. Recent forecasts from the POAMA model, run daily at the Bureau of Meteorology, show a continuation of warming with SSTs remaining above El Niño thresholds into 2010, peaking over the summer months


JUST VOTE OR COMMENT FOR FEEDBACK

EL-NINO INTENSIFYING STRONGER THAN 2002 AND 2006 CONDITION

EL NINO ADVISORY (AS OF 5P NOVEMBER 12, 2009)

IMAGES AND GRAPHS OF LATEST CONDITION OVER EASTERN EQUATORIAL PACIFIC


DISCUSSION

Central equatorial Pacific Ocean temperatures have continued to warm over the past two weeks, and are now at their highest levels since at least the El Niño event of 2002. Similarly, the 30-day Southern Oscillation Index is lower than at any time since 2005. Leading climate models suggest tropical ocean temperatures will remain above El Niño thresholds into the first quarter of 2010. A sustained weakening of the Trade Winds during October and early November enabled central Pacific equatorial temperatures to rise up to 2°C above normal. However, average to stronger than average Trade Winds currently over the western Pacific may curtail any further warming during the next fortnight. The distribution of tropical cloud has similarities to the patterns observed in the 2002 and 2006 El Niño events, while recent rainfall patterns over Australia are typical of mature El Niño conditions. The sub-surface water of the tropical Pacific has also continued to warm, with temperatures as much as 6°C above normal in some regions. Cloudiness near the date-line has been slightly below average in recent weeks. However, cloudiness to the west of the date-line has been consistently above average, as also occurred during the 2006 El Niño and to a lesser extent in the 2002 event. Ocean surface temperatures in the central equatorial Pacific have continued to warm and now exceed levels typical of an El Niño event by their greatest margin since the start of the year. The SST anomaly map for October is available here; the map shows warm anomalies in excess of +1°C covering most of the tropical Pacific east of 160°E, with anomalies exceeding +2°C in parts of the central Pacific. While the central Pacific warmed in October, the far western Pacific west of about 160°E cooled steadily. Until recently, warm SST anomalies had persisted in this region, which was atypical for an El Niño. The map shows near-normal SSTs covering most of the western Pacific and northern waters around Australia. The monthly NINO indices for October were +0.9°C, +1.1°C and +1.3°C for NINO3, NINO3.4 and NINO4 respectively. When compared with September values, NINO4 warmed by approximately +0.5°C and NINO3.4 by approximately +0.2°C. NINO3 remained similar in magnitude. n terms of weekly data, the most recent NINO indices are +1.4°C, +1.7°C and +1.5°C for NINO3, NINO3.4, and NINO4 respectively. When compared with two weeks ago, all NINO indices have warmed; NINO3 by approximately 0.4°C, NINO3.4 by approximately 0.5°C and NINO4 by approximately 0.1°C. All three NINO indices currently have their highest weekly value for 2009. The 7-day SST anomaly map shows warm anomalies in excess of +1°C covering most of the tropical Pacific east of 160°E, with anomalies exceeding +2°C on a weekly scale across most of the central tropical Pacific. When compared with anomalies observed two weeks ago, the ocean surface has warmed in both the central and eastern Pacific. An animation of recent recent SST changes is available. The sub-surface of the equatorial Pacific Ocean has also continued to warm in the last two weeks. A large volume of warmer than normal water is now well established beneath the surface of the tropical Pacific. A four-month sequence of Pacific Ocean equatorial temperature anomaly is available here. The sequence shows cooling of the sub-surface from July through September followed by a relatively rapid warming during October. This warming has continued into November. A recent map for the 5 days ending 9 November shows a large volume of sub-surface water more than 3°C warmer than normal for this time of the year extending across much of the central to eastern equatorial Pacific. Warm anomalies in excess of 6°C are now evident between 150°W and 120°W on a weekly scale. When compared with two weeks ago, the sub-surface has warmed strongly in the central Pacific, related to a strong westerly wind burst in the western Pacific during October. This warming has propagated eastwards during recent weeks. An animation of recent sub-surface changes is available. Cloudiness near the date-line over the equatorial Pacific is another important indicator of El Niño conditions, as it typically increases near and to the east of the dateline during these episodes. Cloudiness near the date-line has generally been slightly below average in recent weeks. However, there has been significant enhanced cloudiness to the west of the date-line, a pattern which is unusual when compared with typical El Niño events, but not unprecedented as such conditions were also observed during the recent 2006 El Niño event and to a lesser extent in the 2002 event. Cloudiness over Indonesia and much of northern and eastern Australia has been below average over the last few months, which is consistent with typical El Niño conditions.

For more information click this link: WEEKLY EL-NINO REPORT.

COURTESY:
NOAA/NWS/CPC
AUSTRALIAN METEOROLOGY


JUST VOTE OR COMMENT FOR FEEDBACK

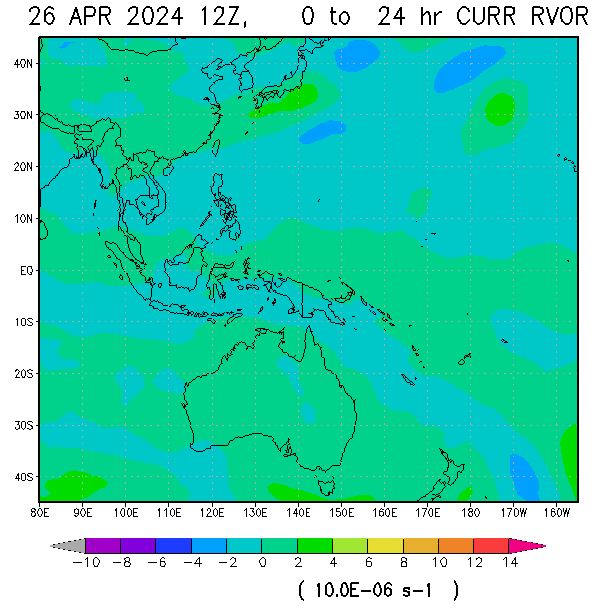
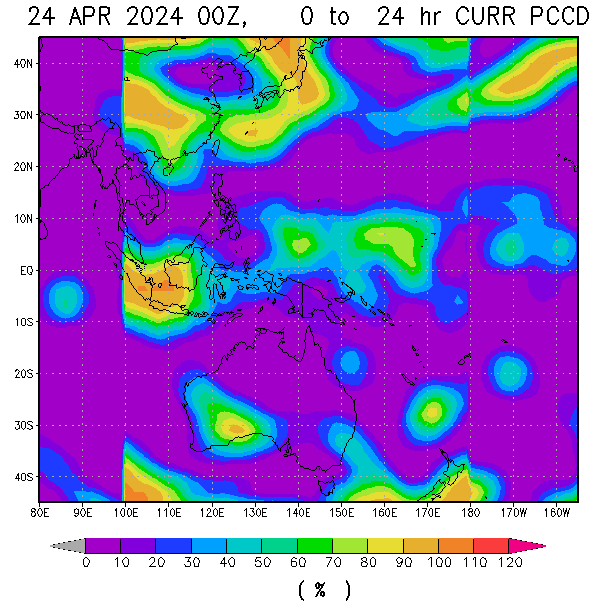
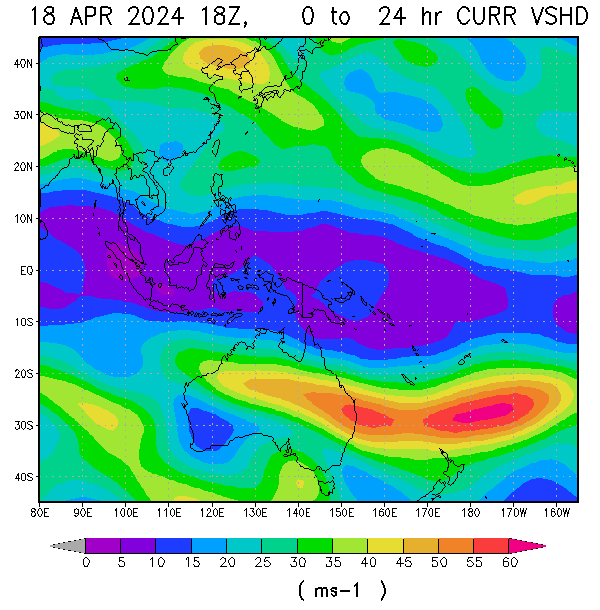
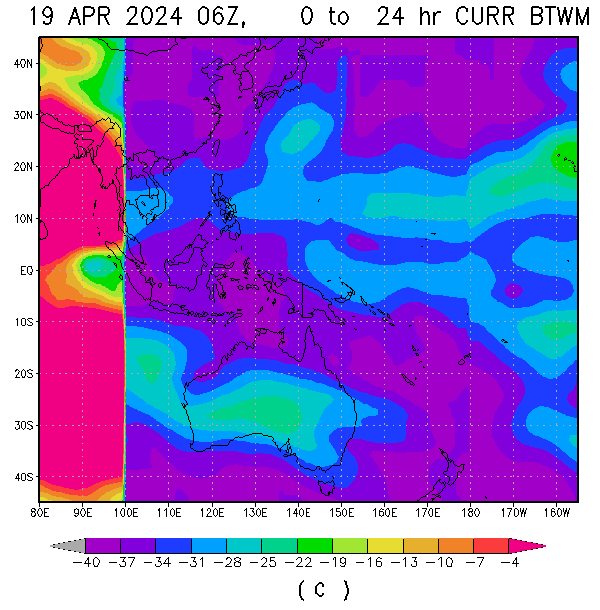
VORTICITY Percent Pixels Colder than -40°C 850-200 hPa Vertical Shear (kt) Cloud-cleared Water Vapor Brightness Temperature (°C)MSLP (hPa)

HIMAWARI WESTERN PACIFIC IR TEMPERATURE IMAGERY

MY TWEETER

News & Journalism - Top Blogs Philippines
Academics

GOOGLE SEARCH TOPIC

Top Stories - Google News

Blog Archive

REFRESH TO UPDATE